
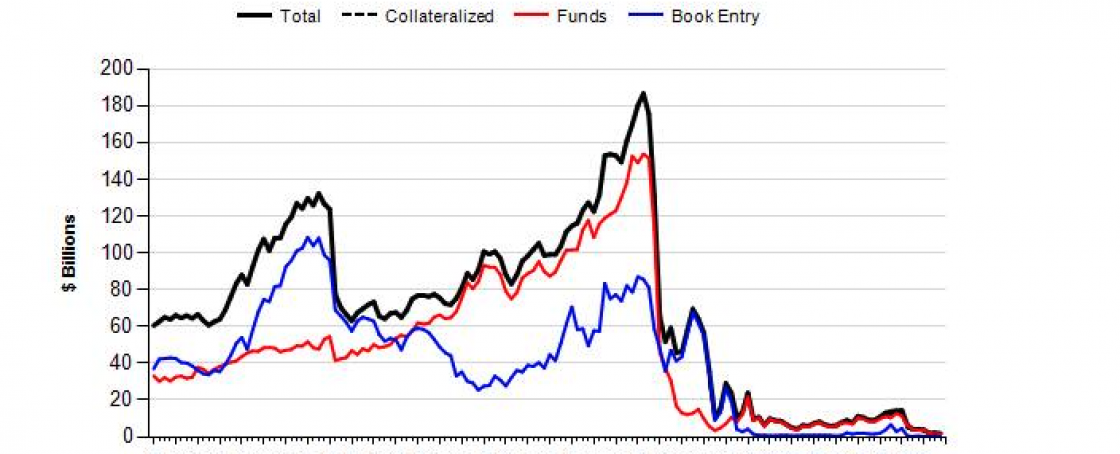
I’m working on a bigger story to do with US dollar intraday liquidity, but until that’s done I wanted to quickly flag something specific to paid subscribers as a small preview.
It’s the Daylight Overdrafts and Fees page of the Federal Reserve website:
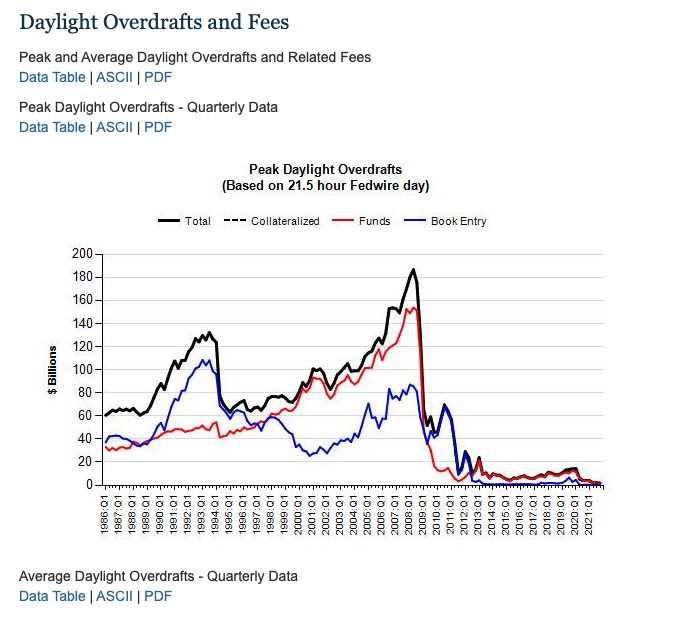
And specifically this bit:

What’s important about that?
Well, as the Wayback Machine can testify, the last time this chart was updated was on February 4, 2020. But given that the data is supposed to be updated quarterly, that’s a little bit weird.
As one of the few people in the world who tracks daylight overdrafts somewhat compulsively, I had clocked that the data was failing to update a while back. I didn’t think anything of it until I was on a panel with some money-market academic types who confirmed they too had spotted the anomaly, and were equally perplexed by it.
I tried to get to the bottom of the situation in December 2021 when researching this column about the stigma associated with the facility since 2008. Needless to say, nobody at the Fed ever answered my questions.
Then, lo and behold, when I finally took to writing about a different aspect of intraday liquidity last week I discovered the data had been mysteriously updated on March 22. Clearly the series was not discontinued after all.
Why all the mystery? It’s hard to say.
I suspect it may be related to the subtle growth in the facility’s use as the Covid crisis unfolded in March 2020.
Breaking into the granular data, it’s clear the most stressful two-week period occurred around March 11:
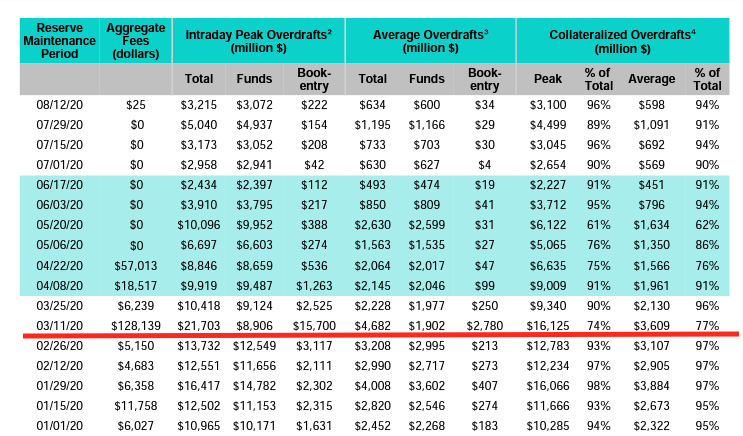
This ties in with my grander theory that the more continuous and global an RTGS system gets, the bigger its appetite becomes for a daily swingable float that’s funded by third parties or the Fed. Without it, payment system risk beckons.
For the most part, however, the excess reserves generated by QE since 2008 have been fulfilling that daily float role. In doing so they have prevented an absolutely huge expansion in the use of intraday overdraft facilities at the Fed (and other central banks).
This, however, also means that the de facto daily minimum float requirement for managing payment system risk is now analogous to the lowest comfortable level of reserves that the system can cope with more generally before freaking out.
As the Fed begins to tighten and remove excess reserves from the system, overdraft data should be watched carefully. (Let’s hope it remains regularly updated.)
My hunch is that if any pressure is detected the system will soon be forced to develop a better and smarter way of funding intraday imbalances associated with payment liquidity risk than just relying on excess reserves.
In time, I suspect, this could involve the creation of an actively traded intraday funding market. Some of the systems the crypto markets have designed to cope with similar pressures might provide an important template for this market’s design.
I’m specifically thinking of one particular product. But more on that later…

One Response
My thesis is that this spike was when China – knowing demand was about to collapse cuz global lockdown – sold Treasuries in order to free up dollars for cheap oil purchases and massively disturbed the market in doing so.
The rapid decline in WTI oil price which followed blew through the post-Abqaiq (Sept 14th 2019) oil bubble/peg inflated by “Big Long” tripartite prepay ( USO WTI , 6 Month Treasury strip & NotQE liquidity) purchases. Note “NotQE” involving the Big Four clearing banks kicked in immediately post Abqaiq and I remember we discussed commodity margin moves as a possible reason for a Treasury spike then.
Note that the above overdraft episode ends by 22nd April, immediately after the ludicrous negative oil price episode on 20th April. The China “Treasure” fund losses (wtf were they doing trading up to the day before WTI expired?) were central and in which the US financial establishment was clearly complicit: CME knew -ve prices were coming (how?) and CFTC failed to investigate properly (why?).
Note also the faux “Saudi Oil War” wave of Saudi tankers (chartered weeks earlier) delivering into the May & June WTI delivery windows in order to top up the $2bn USO physical oil pool.
After this episode, the WTI USO paradigm changed from Mth 1/2 futures & 6 month Treasury strip to Mths 2 through 13 futures & Treasury Notes. Finally, as grist to the Izzy mill there’s also the involvement in this paradigm shift of what appear to have been legions of Robin Hood USO bots.
https://www.thestreet.com/etffocus/trade-ideas/robinhood-accounts-dumping-uso-just-as-share-price-jumps-14-in-two-days
https://www.cnbc.com/2020/04/23/young-investors-rush-into-struggling-oil-etf-that-isnt-even-tracking-the-price-of-oil-anymore.html
Bottom line, it seems to me that the entire episode was oil related, and moreover my thesis is that this geopolitical manipulation was reactivated when US got wind of the Russian attack on Ukraine.