Sometimes a picture says a thousand words. Other times a graph or a table does even better. The Blind Spot has been collecting its favourites over the last couple of months and here’s the best of them.
They’re sourced from all sorts of weird places, and if the source isn’t clear, that’s our bad. In our haste to collect things we may have got over zealous and overlooked the collection of the original link. We have still included the chart in this edition, but will endeavour to do better next time.
US Personal Savings at Historic Bottoms, Credit Card Loans Near Historic Highs

Amazon May Struggle Without Amazon Web Services
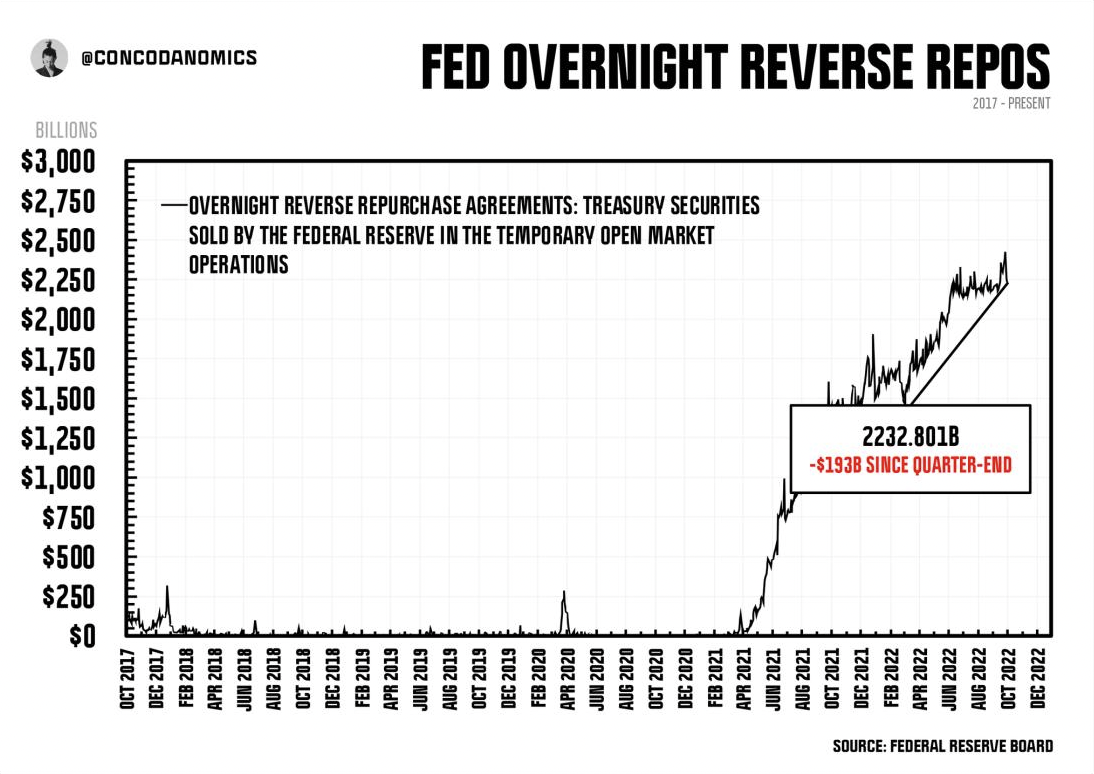
Fed Overnight Reverse Repos Shoot Up:
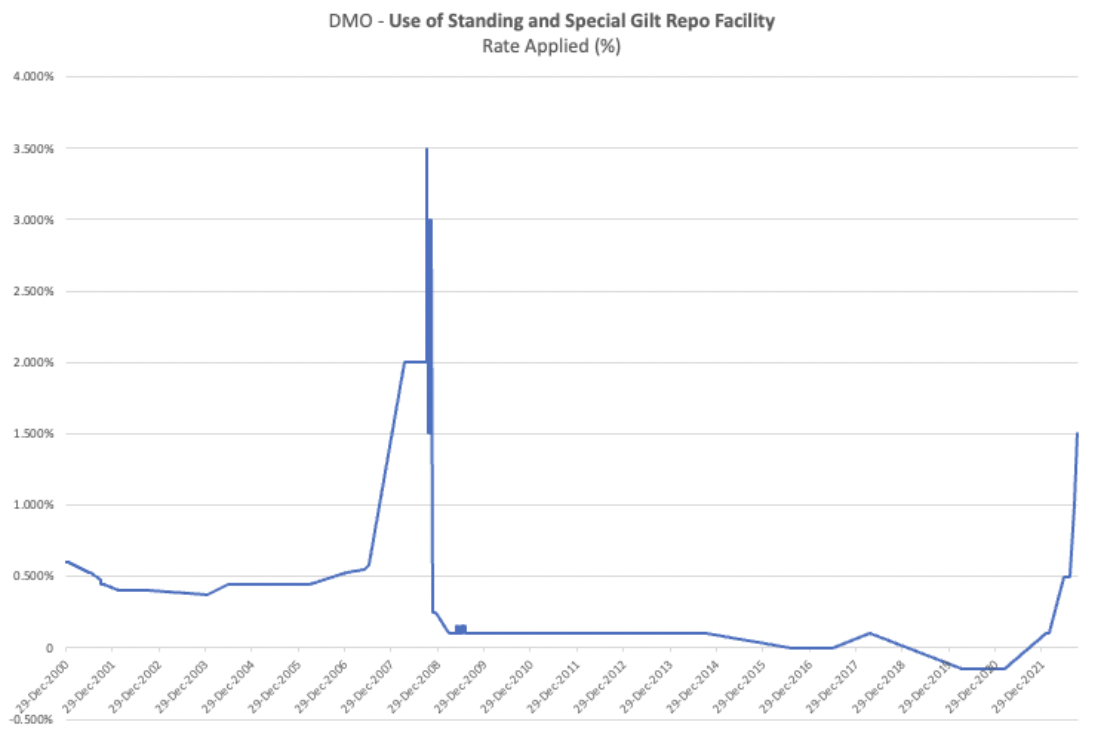
Rates Charged For Use of DMO’s Standing and Special Gilt Repo Facility:
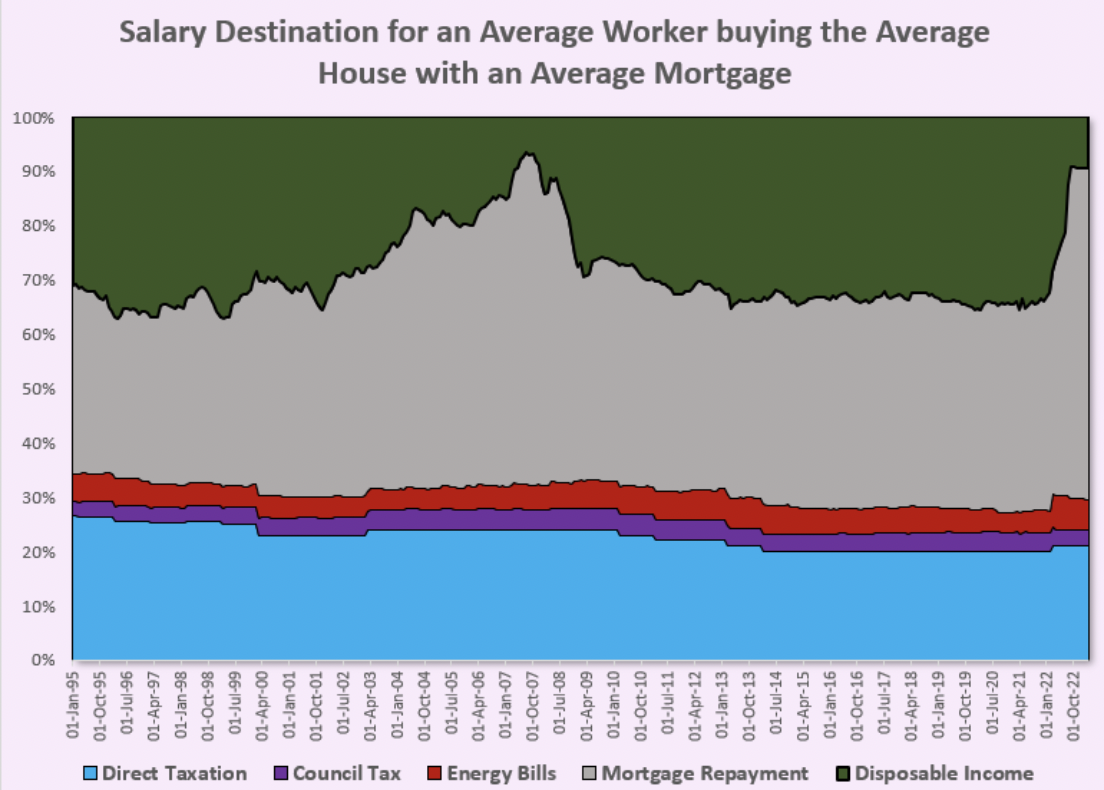
Where Does the Salary for the Average Worker Purchasing the Average House with an Average Mortgage Go?
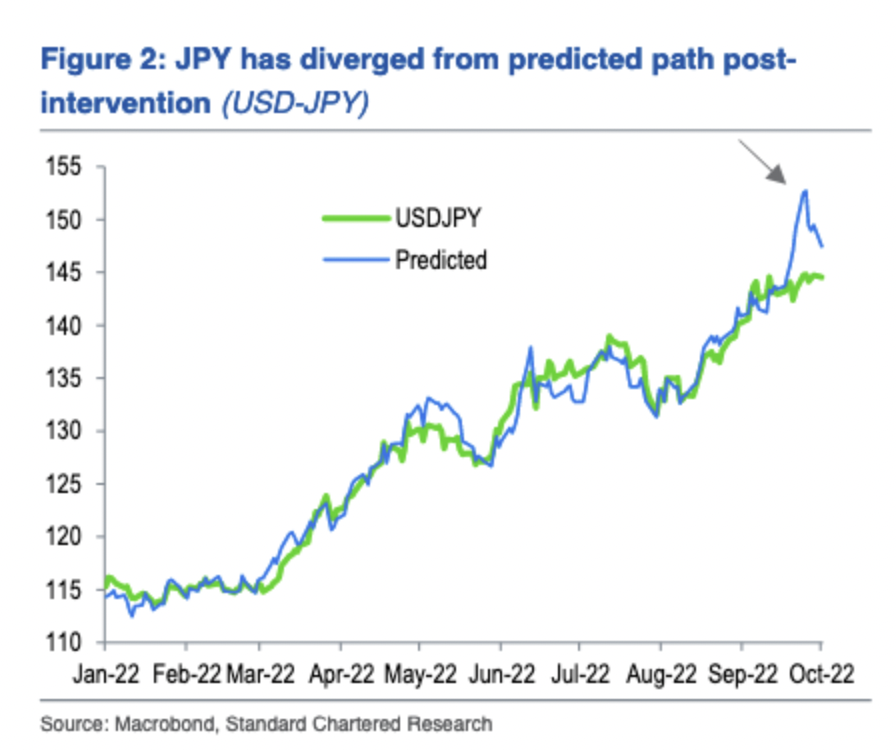
JPY Has Performed Better Than Expected:
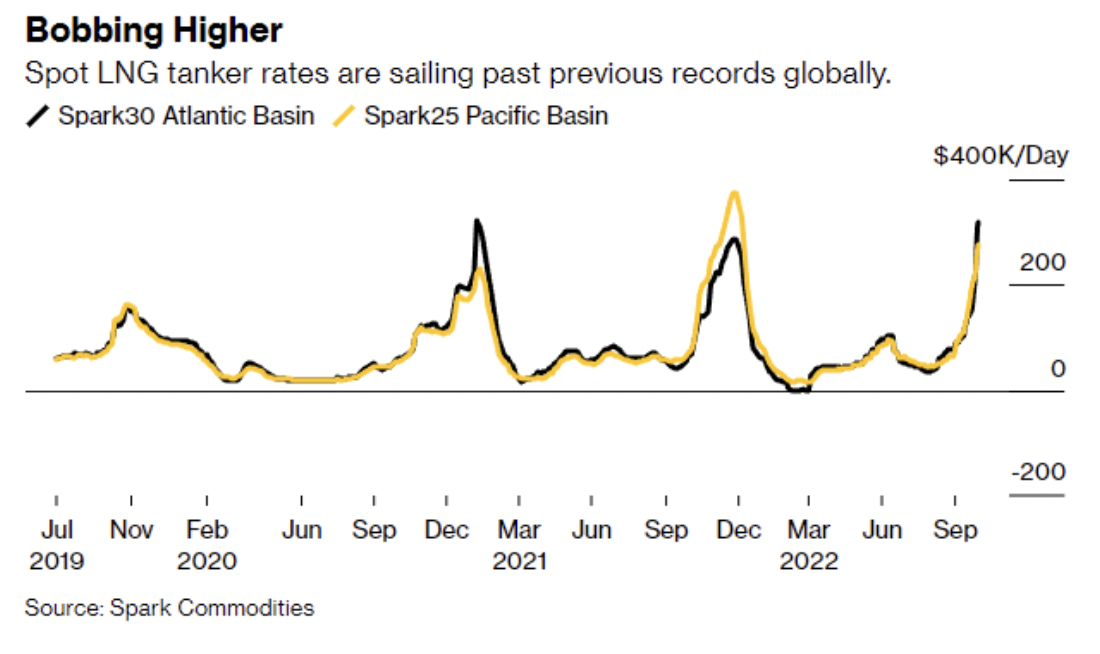
Spot LNG Tanker Rates Are Skyrocketing:
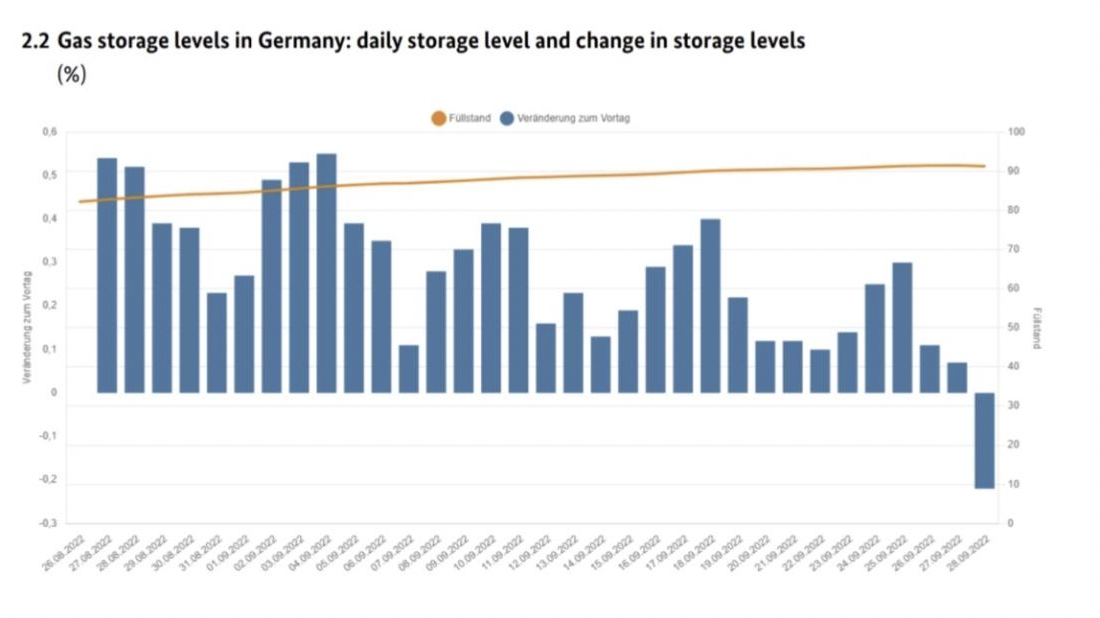
Gas Storage Levels in Germany Drop Suddenly:
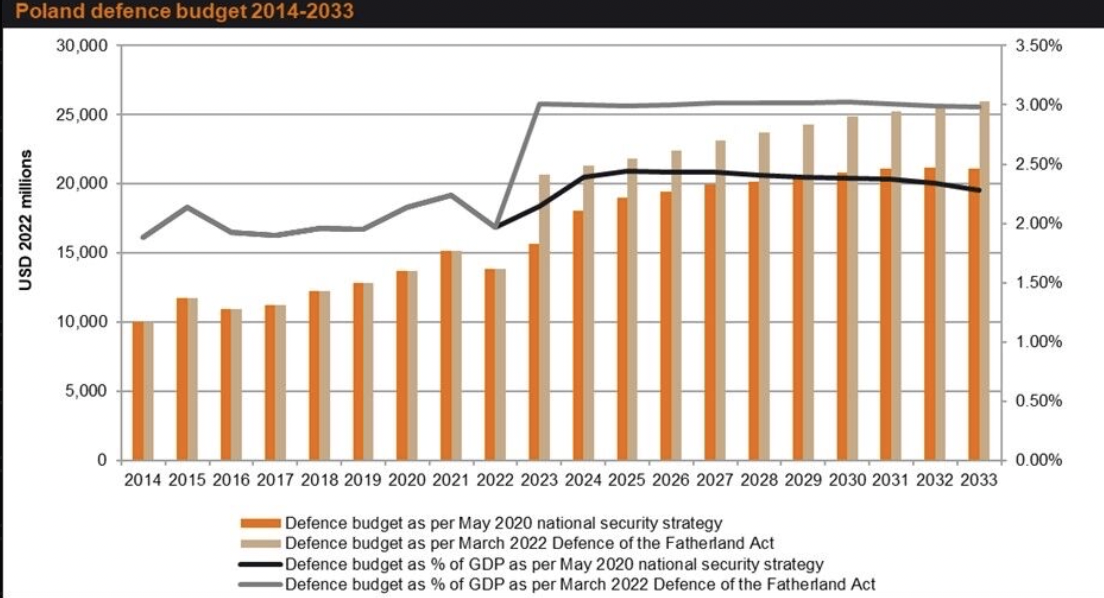
Poland’s Defence Budget Increases Would Make Trump Happy:
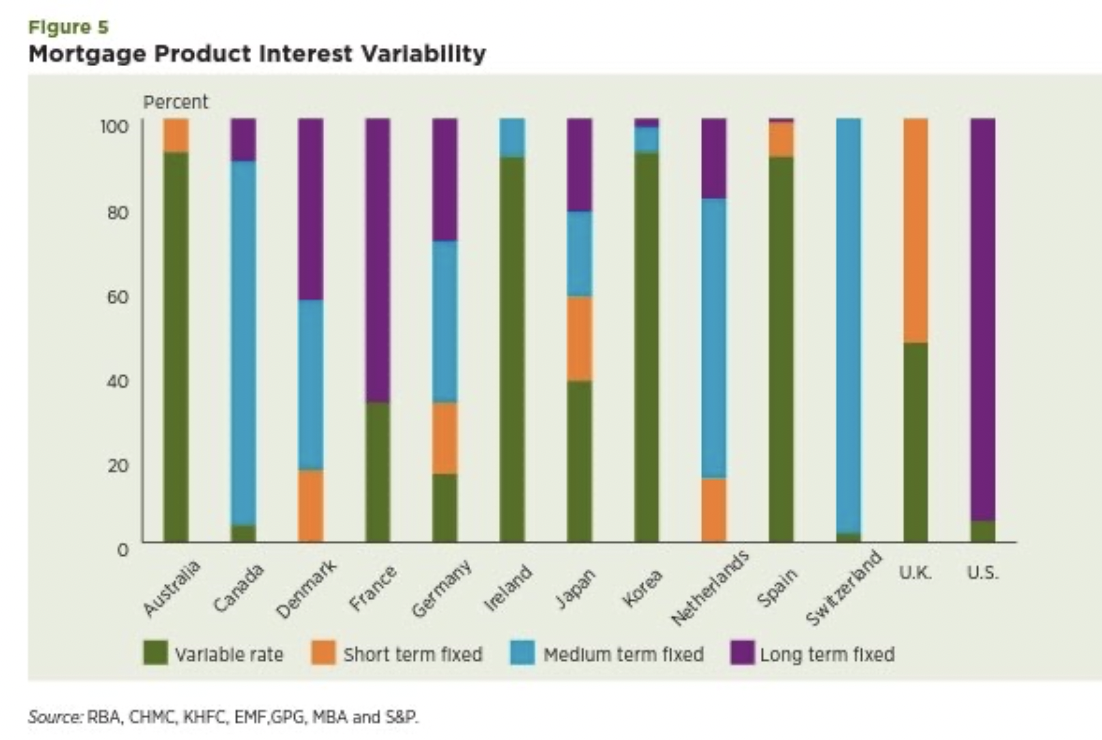
Developed Economies’ Mortgage Product Interest Variability:
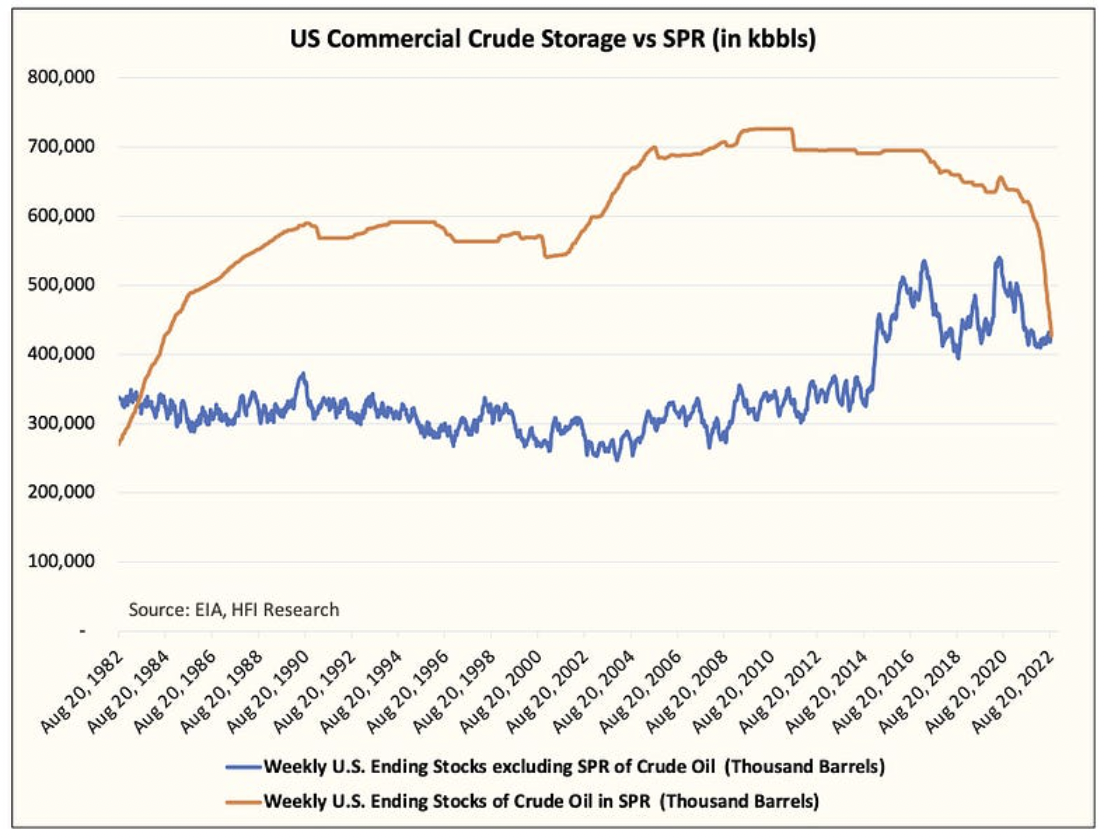
US Commercial Crude Storage Versus Strategic Petroleum Reserves:
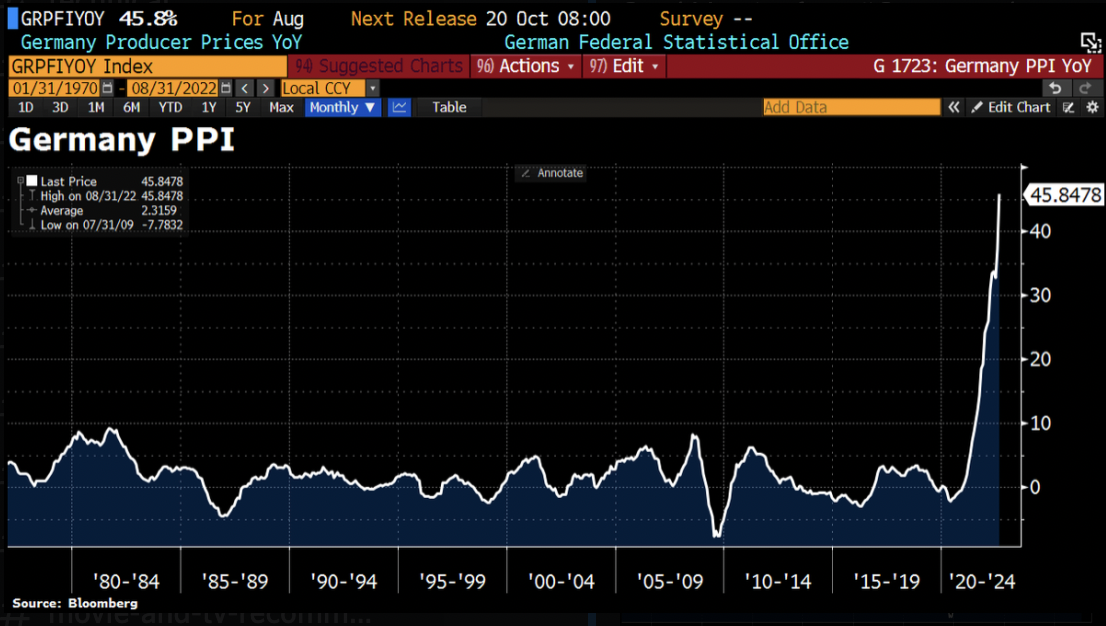
Germany’s Inflation Suffers Largest Increase Since Records Began:
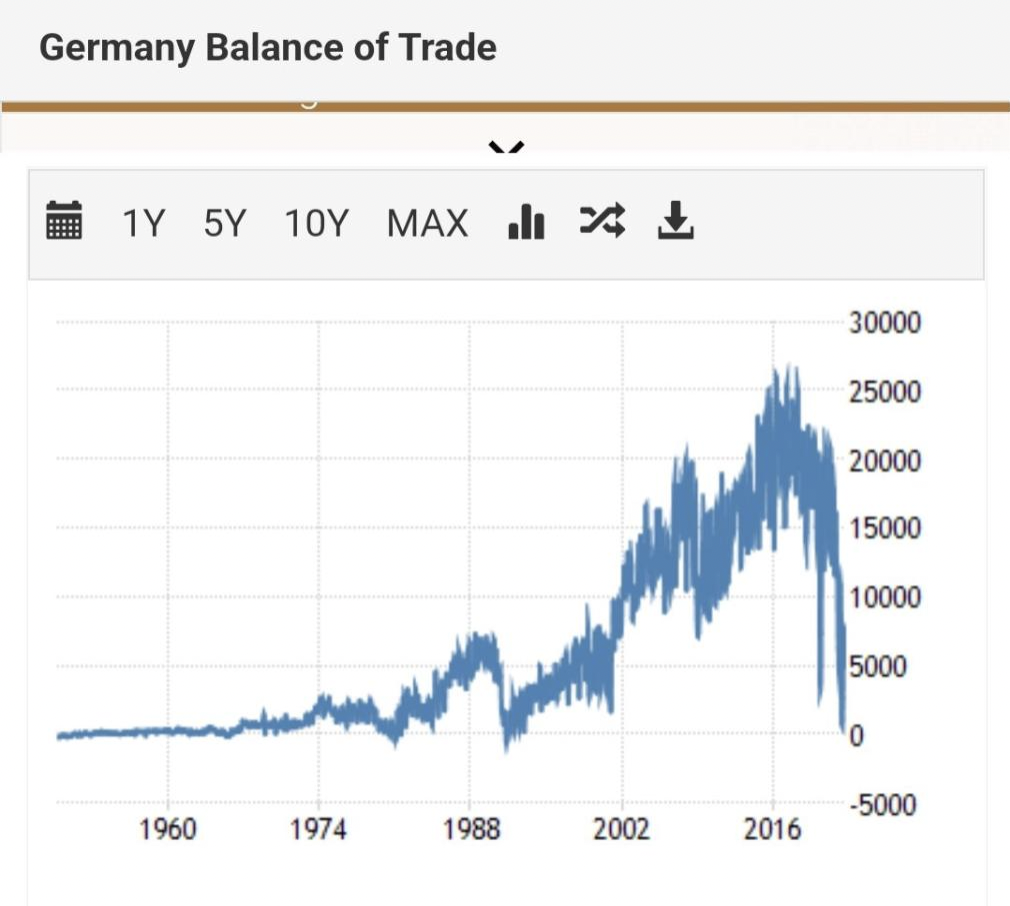
Germany’s Balance of Trade Going South:
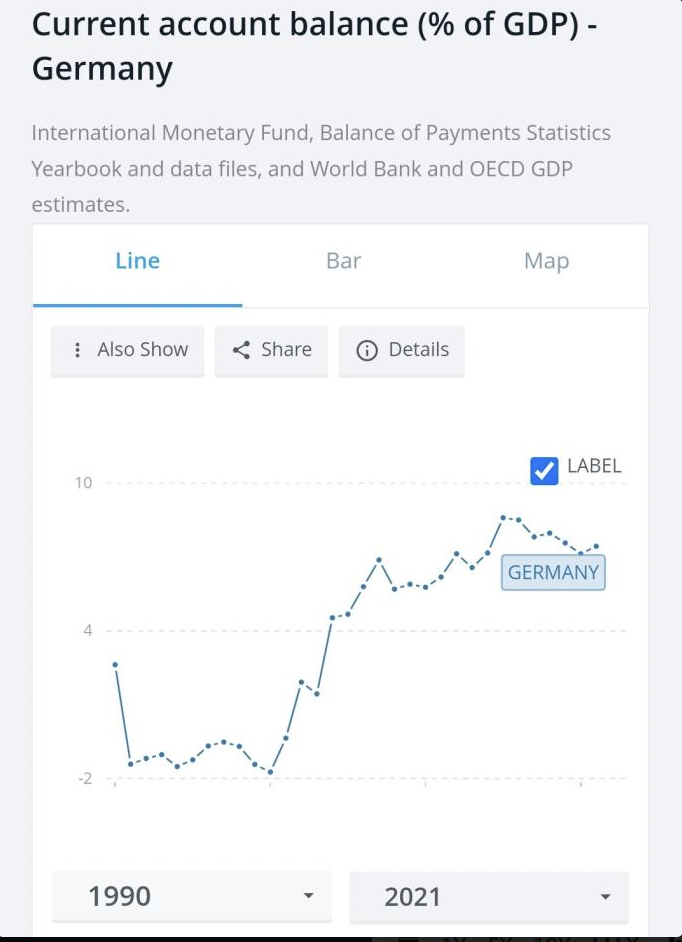
Germany’s Account Balance as Percentage of GDP Since 1990:
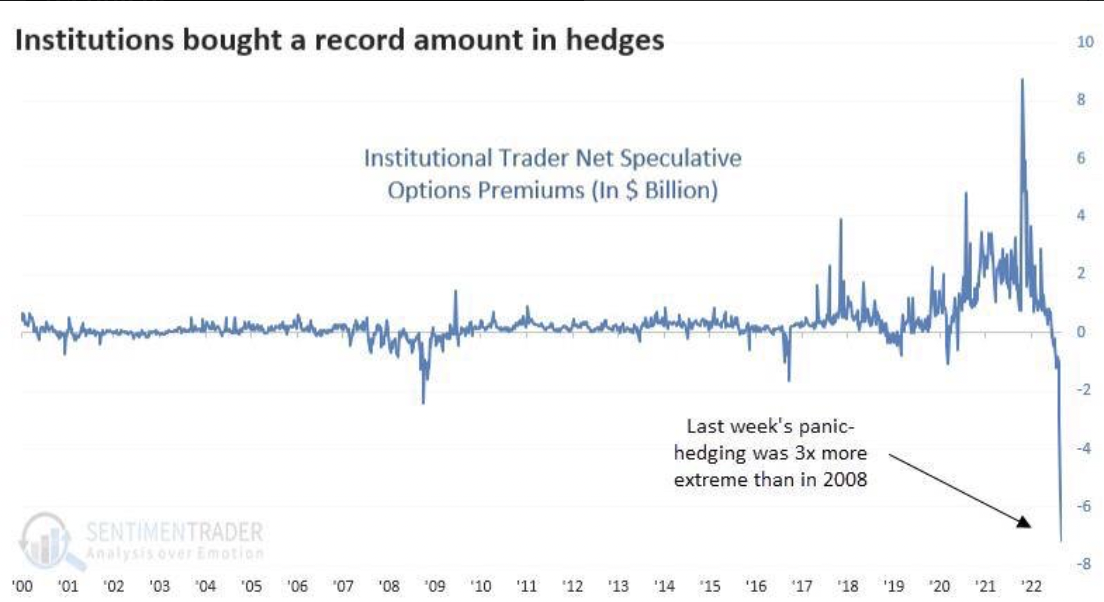
Institutions Are Buying Record Amounts of Hedges:
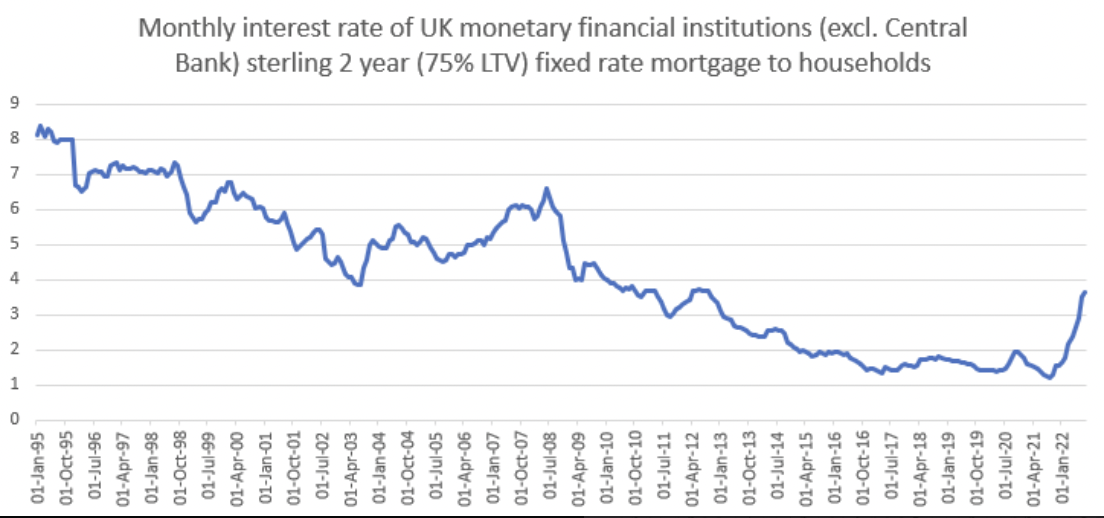
UK Monetary Financial Institutions’ Monthly Interest Rates (Excluding Central Bank):
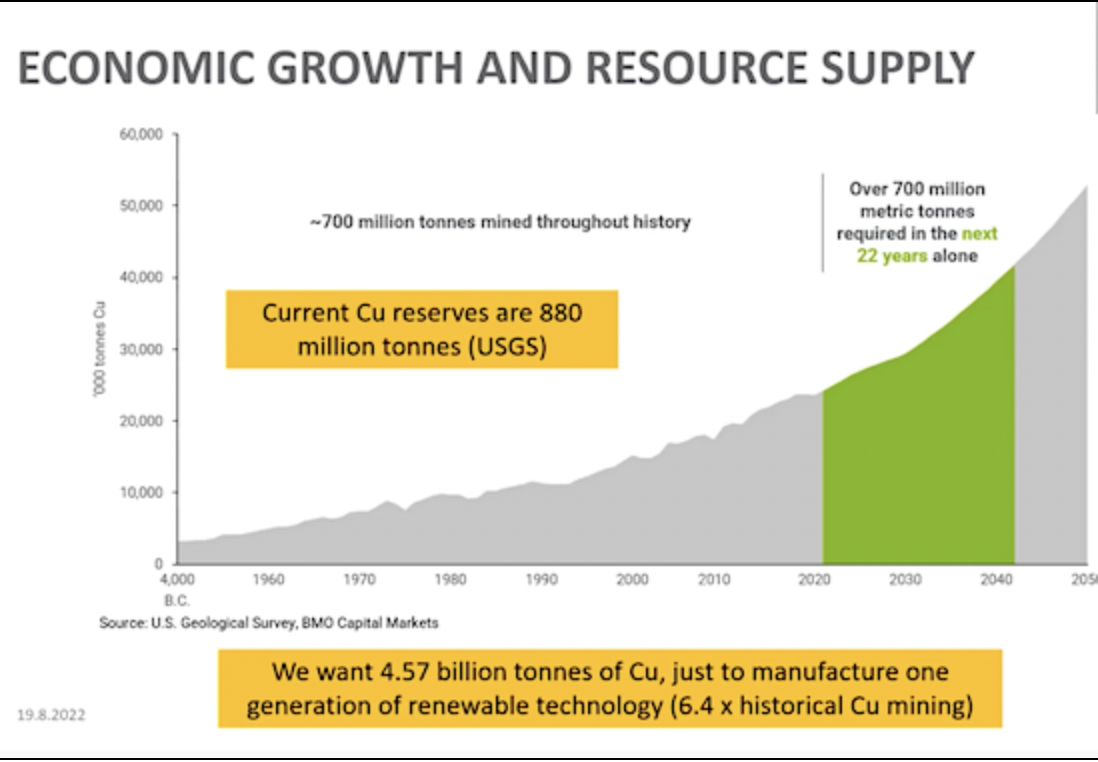
Impossibility of The Green Revolution: Copper Reserves Insufficient for Renewables Transition: