Warning: This is an entirely speculative post centred on my long-running (albeit somewhat anecdotally informed) hunch that “create-to-lend” (CTL) practices in ETF market-making have been generating larger than-appreciated naked short positions in the market. It is also a whopper.
Bloomberg reported on Monday that quants were being forced to shed $225bn of short bets in a big squeeze.
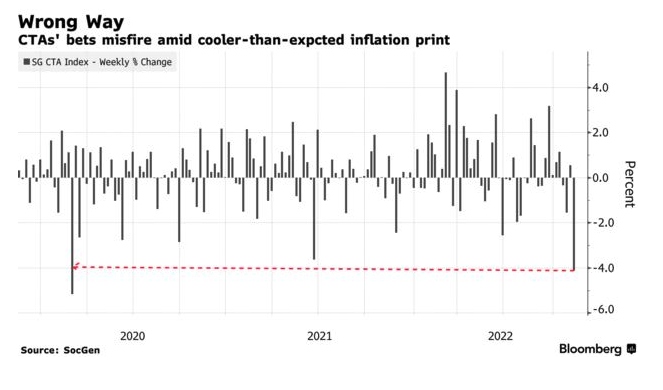
JP Morgan strategist Nikolaos Panigirtzoglou put this down to trend-following traders (CTAs) being compelled to unwind short positions totalling about $150bn in equities and $75bn in fixed income.
But as Bloomberg readily admits, it’s hard to say for sure what’s going on, or what is really behind the rally:
Getting a grip on the exact picture of the quant world is far from easy. Models built on subjective assumptions often spit out different numbers. A similar analysis by Nomura Securities International’s cross-asset strategist Charlie McElligott, for instance, showed that the systematic cohort bought a more modest $61.4 billion of stocks and $2 billion of bonds last week.
Still, the analysis helps shed light on the fierce rally, one that many say was an over-reaction to the softer-than-expected reading in October’s consumer price index. At a minimum, the exercise illustrates the importance of tracking technical indicators such as fund positioning at a time when the fundamental picture remains murky.
Meanwhile, the cost to borrow meme stock darling AMC is apparently heading over 100 per cent.
My hunch is that this rally could in part be related to an almighty (possibly naked) short-covering episode by the world’s top systematic trading firms — especially those focused on ETF arbitrage.
Anecdotally, the perfect countercyclicality of ETF flows seems once again to support the idea that these trends are much more likely to be connected to smart money having to cover short positions than retail investors savvily identifying market bottoms.
Important Background and Context
Back when I first started writing about ETFs, around 2009, there was very little in the public domain about how bank Delta One departments interacted with ETFs, the role authorised participants played in the market or how closely connected ETF market-making was to high-frequency trading and algo trading.
The whole industry was very murky and the big algo shops like EWT (which was later absorbed into Virtu), Jane Street, Susquehanna, Optiver, etc were completely below the radar. They had by then started to pop up as significant holders of equity stock on Bloomberg terminal tallies, but in the financial journalism field by and large nobody had heard of them. I was one of a few reporters asking awkward questions about how they operated.
(As an aside, it was a similar story with commodity traders, Glencore, Mercuria, etc.)
What I immediately noticed once I started asking questions was the intensity and caginess of the pro-ETF marketing lobby. The pros were incredibly hostile to journalists asking questions about how these things were structured or how they operated behind the scenes.
“They just work, okay!? Investors benefit from how cheap they are! Why are you asking awkward questions?! Do you hate retail investors? Do you want mom and pop to pay more to trade!? Why would you do that? Everything works because it’s all based on the efficient market hypothesis and arbitrage! Are you an idiot?”
What they didn’t appreciate was that my mother had always taught me that “if something is too good to be true it usually is”, and “if you pay peanuts you get monkeys”. My curiousity was not quenched.
In hindsight, I daresay the entire industry was being marketed in a very similar manner to the crypto one. Which shouldn’t be surprising since ETFs operate in part like collateralised exchange-based cryptos.
And so it was that I delved ever deeper into the design and composition of ETFs as well as their supporting market structure. To be clear, I didn’t think all ETFs were bad. I just thought the structure was predisposed to obscuring potential bad practice, such as naked short selling.
It was in this way that I came across all the settlement anomalies in ETFs. There were certain ETFs, such as leveraged ones or specific names like XRT (the retail one), that would repeatedly find themselves on the fail-to-deliver (FTD) lists for many consecutive days. But it didn’t matter, I was always told by industry practitioners. These were merely “clerical” errors.
Eventually, somebody in the industry let slip about something called the “create-to-lend” (CTL) function. They speculated that this mechanism (which allows market makers to create ETFs specifically for lending to hedge funds) could possibly be playing a key role in driving ETF fails. Again, there was literally NOTHING written about this publicly at the time, or at least that could be accessed via the usual public channels.
Slowly, I began piecing all the various scraps of info being thrown to me by insiders to form a bigger picture. But even then, it was hard to really ascertain exactly what was going on at the big market-making shops. Editorial enthusiasm for the story was also low.
Other journalists simply didn’t seem interested. Weirdly, even when blockchain fanaticism hit the market — a period when many established industry players suddenly broke rank about the importance of swift settlement in equities — the perennial settlement failure problem in the ETF industry seemed to pass reporters by.
It really was very odd. On one hand, the market was admitting accelerated stock settlement was needed to make the market more resilient, on the other hand, nobody wanted to talk about ETF fails. They were still being blamed on operational factors related to the fact that ETF market makers were entitled to exemptions on T+2 settlement when conventional stock market makers were not.
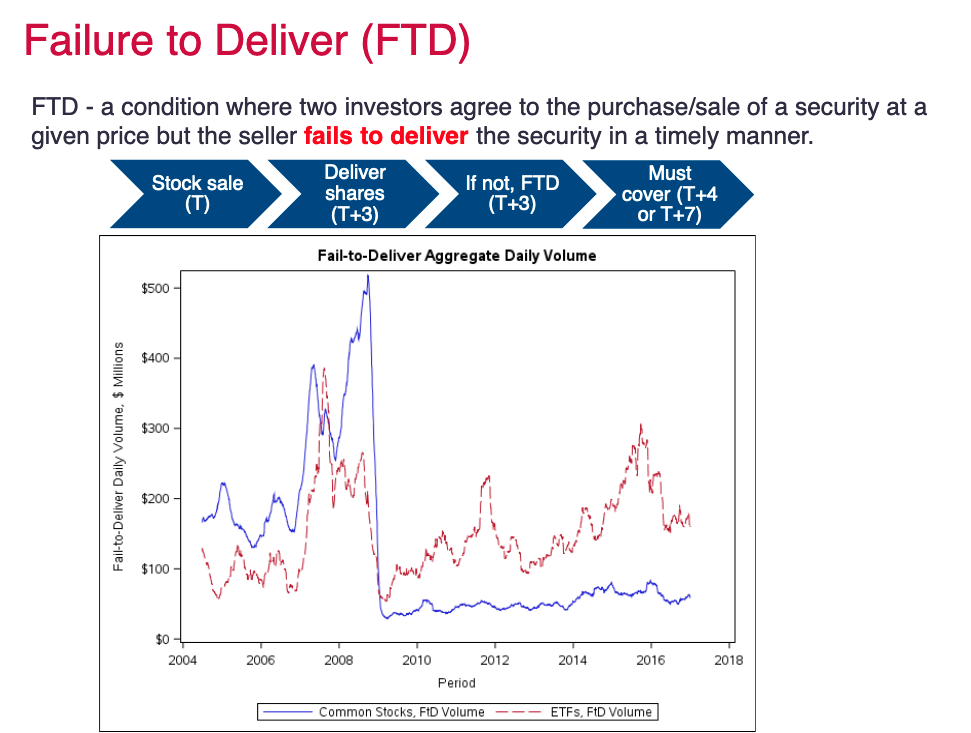
Here’s a nice chart from 2018 courtesy of Richard Evans, of the Darden School of Business at the University of Virginia reflecting the problem:
A lot has happened since then.
Most recently, Richard Evans has joined forces with Rabih Moussawi, Michael S. Pagano and John Sedunov of Villanova University to pen a new paper that outlines the degree of operational naked shorting in the ETF market. The abstract sums up the state of affairs quite decisively (our emphasis):
Due to a regulatory exemption, ETF market makers can satisfy excess demand in secondary markets by selling ETF shares that have not yet been created. While this ability to “operationally short” is not unique to ETFs, it plays a more prominent role in ETF liquidity provision, and results in elevated ETF failures–to–deliver. We propose a novel measure for “operational shorting” and show it is associated with improved liquidity and greater price efficiency in the ETF underlying securities. Higher retail trading activity and short–term return reversals are also consistent with liquidity–supplying motives rather than informed trading. Consequently, delayed ETF creation to cover operational shorts is found to be a valuable option in the presence of retail trading and liquidity mismatches between the ETF and its underlying securities.
But the authors argue that much of this is not malevolent. As they explain: “We provide compelling evidence that the high levels of ETF FTDs and short interest do not represent abusive short-selling, but rather represent the exercise of the option afforded APs to operationally short ETFs for liquidity provision.”
To me, this seems a little naive. Regardless of whether the operational shorting is intentionally directional or not, the solvency and liquidity risk transferred to the market is as real as anything connected to directional naked shorting. Evans and his co-authors also fail to connect “operational shorting” activity to “create-to-lend” activity. They focus instead on “short and create” strategies, whose impact on operational shorting is as follows:
If the buy–sell trade imbalance is positive at a given point in time but there is no contemporaneous creation of the ETF shares, then the AP is operationally short those shares because they have yet to create and deliver them to investors.
These strategies are undoubtedly real, but they’re much more likely to bear market risk when connected to the circularity associated with “create-to-lend” activities. This is because large stock borrowing demand from hedge funds cultivates similar buy-sell trade imbalances. After all, large stock borrowing demand from hedge funds would in theory cultivate similar buy-sell trade imbalances, encouraging even greater operational shorts in the system.
Why Are ETF Lending Fees So High?
Luckily, two other recent academic papers shed further light on the connection between “create-to-lend” and operational shorting.
First is a 2021 academic paper by Sanjeev Bhojrah of Cornell University and Wuyang Zhao of the University of Texas at Austin, which argues create-to-lend was born out of the friction and complexity of lending ETFs, in part because mutual funds, the biggest stock-lenders (who obviously compete with ETFs), don’t own ETFs and therefore have no capacity to lend them.
As the abstract notes:
We find that exchange–traded fund (ETF) lending fees are significantly higher than stock lending fees. Two institutional features unique to ETFs play significant roles in explaining the high fees. First, regulations restrict investment companies, such as mutual funds and ETFs, from owning ETFs. As these institutions are key lenders, their absence reduces the lendable supply in the ETF loan market. Second, while the create–to–lend (CTL) mechanism alleviates supply constraints when borrowing demand increases, its efficacy is limited by the associated costs and frictions. Our results speak to the limits to arbitrage in the ETF markets.
This is somewhat insightful.
The market seemingly came up with create-to-lend mechanism to alleviate the shortage of loanable ETF stock. But as the authors note, in doing so, the market may have also inadvertently introduced new risks and frictions with it. The fact that ETF lending fees remain consistently higher than stock lending fees certainly indicates some sort of market inefficiency.
As the academics put it (our emphasis):
When a lender is unable to locate ETF shares to lend from the existing inventory, she can
borrow the shares of the underlying constituents and deliver them to the ETF sponsor in exchange
for ETF shares. These newly issued ETF shares are then lent to the short–seller. This mechanism
creates several costs and frictions in the process.• First, the lender has to borrow the entire creation basket and therefore faces ongoing borrowing
costs, which are the weighted borrowing costs of the creation basket.
• Second, the lender has to pay management fees to the ETF sponsor, but can compensate for
this cost by charging borrowers higher lending fees.
• Third, the lender faces volatility risk when there are shares that cannot be borrowed. This is
because the ETF has holdings in all the underlying assets, but the hedge is only available on
the shares that can be borrowed. For all other constituents the lender is either unhedged or will
have to find alternative means of hedging.
• Fourth, the lender faces the re-call risk from the stock lenders in any of the underlying
securities because of corporate events or lendable shares that may dry up. In the event of a buy-
in (i.e., forced to close the short positions on the underlying securities), the lender is left
unhedged in those positions.
• Fifth, to the extent that the ETF has “excluded assets” that are part of its existing holdings but
are not in the creation baskets, the lender will have to find ways to hedge out the risk from
those positions using other costly approaches.
• Sixth, ETFs are normally created in units of 10,000 to 100,000 ETF shares, though this can
vary from as low as 1,000 shares to as high as 250,000 shares in rare instances. When the short-
seller needs to borrower fewer shares, the lender will have to carry the financing costs and the
balance sheet risk on the remaining shares until those can be lent in the future.
It seems reasonable that these frictions combined with market pressure to move quickly could have encouraged many operators to “lend ETFs first” and then scramble to cover the necessary collateral second.
A similar pattern can be seen in how banks operate in lending markets. As market commentator Frances Coppola likes to repeat, banks routinely (also for operational reasons) lend first and fund later — only panicking or collapsing if and when a shortfall is discovered at the last minute.
If that’s true, many ETF units in market circulation may be being magicked into existence by market-makers and authorised participants in the form of direct liabilities (claims by others on themselves) on the assumption that all the settlement rigmarole gets done in the end. This is fair enough to assume based on banking practice.
Sadly, time and time again it is proved to be a bad assumption.
Having tracked the fail-to-deliver (FTD) issue in the ETF market for a long time, I can confidently report that ETFs are among the most common stocks to end up on the NYSE Threshold Securities list. This is a routinely published list that registers all securities with aggregate fail-to-deliver positions totalling 10,000 shares or more.
Back in the early days of my covering of this story, ETFs — especially leveraged ones — would tally up absolutely extraordinary consecutive days on the “fail to deliver” threshold totals. Here’s an example from October 14, 2010. (I would love an updated version of this list, but can’t seem to find one.)
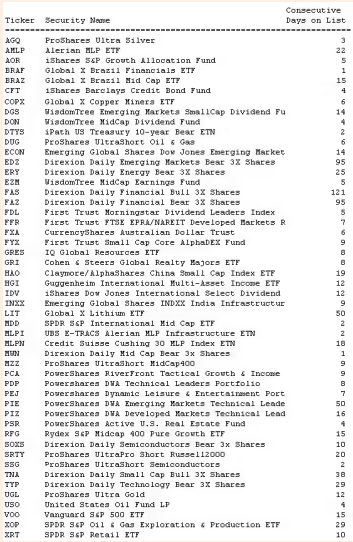
It’s probably no coincidence that many of the most failed-to-deliver ETFs boasted the greatest imbalance of registered owners to outstanding shares. As reported in FT Alphaville in 2011, if you took the top 20 holders of the XRT ETF at the time, their total holdings equalled over 750 per cent of the shares outstanding in the fund, implying seven different parties had a claim on any existing unit of XRT.
The WallStreetBets “Degens” Pick Up on The Story
Some might be surprised that it is the so-called “degens” and “apes” of the WallStreetBets community, not the Wall Street Journal or the Financial Times, who are pursuing the operational short story in any detail. But that is definitely the case. It is the degens who spotted early on that XRT, the ETF which tracks the SPDR S&P Retail ETF and which includes Gamestop as a constituent, was popping up on the FTD security fail list. And it is they who just won’t let go of the story.
Here, as an example, is a community post about the whole thing from eight months ago:
XRT has been on the Securities threshold list since December 17th. from Superstonk
Here’s another one from a year ago:
AMC is #1 Stonk On NYSE Threshold Security List in 2020 + 2021. No dates. Be patient, positive and take a break. We got this 🦍❤️🦍 from amcstock
Here’s one about how Bed Bath & Beyond keeps making a regular appearance on the threshold list.
And here’s a post about how AMC fails to deliver “exploded” in October (to name a few):
That Citadel, a major ETF market arbitrageur, ended up as one of the most exposed entities in the Gamestop fiasco is probably not a coincidence. It is entirely conceivable that the evil short the apes became obsessed with closing out was more “operational” than hedge-fund directional.
So what’s really going on and what are the risks?
A good clue comes in the shape of the latest tweet from the founder of collapsed crypto exchange FTX, Sam Bankman-Fried, a former Jane Street ETF arbitrageur:
15) A few weeks ago, FTX was handling ~$10b/day of volume and billions of transfers.
But there was too much leverage–more than I realized. A run on the bank and market crash exhausted liquidity.
So what can I try to do? Raise liquidity, make customers whole, and restart.
— SBF (@SBF_FTX) November 16, 2022
Why would someone like SBF, who cut his teeth market-making ETFs on Main Street, not clock that his exchange and fund had more leverage than he realised? One possibility is that the practices he took for granted as working in conventional index arbitrage markets (i.e. magicking stock liabilities out of thin air to those who want to borrow them and then sourcing, collateralising, or hedging them later) didn’t translate all that well to the crypto markets — which for all their faults and ponzi-dynamics do at least operate on the principle of instant settlement.
In crypto, unlike in conventional markets, the ability to keep rolling a fail-to-deliver beyond a T+0 settlement deadline is eventually limited at some point in the chain. When the end of the line comes, failure is inevitable. When it fails, it fails. And usually, it does so spectacularly.
On the contrary, those caught short in conventional markets often face a number of economic choices. For example, if the regulatory penalty for failing to deliver is lower than the cost of buying-in the necessary securities or borrowing them at elevated rates, one’s failing capacity becomes a mere function of one’s capacity to keep up with penalty payments. That means for as long as the hedge fund industry is happy to compensate you for the penalties of failing to deliver, your capacity to keep failing is theoretically limitless.
This begs the question of whether rising borrowing costs have a greater bearing on ETF valuation than many appreciate. Bhojrah and Zhao suggest yes:
Our findings have implications for the role of ETFs in market efficiency. We present
evidence of, and reasons for, a significant limit to arbitrage — very high lending fees in the ETF
loan market. High lending fees adversely affect market efficiency by triggering ETF overvaluation
and hindering the hedging role of ETFs (Huang et al., 2020). While the stock loan market is well
understood (e.g., D’Avolio, 2002; Geczy et al., 2002), the ETF loan market is very different in its
institutional details and empirical characteristics. Understanding the ETF loan market is a
prerequisite when studying the use of ETFs as a short–selling device. For example, researchers
who study shorting ETFs when the liquidity of the constituents is poor should carefully consider
how this lack of liquidity affects the ETF lending market, the lending fees, and the CTL
mechanism. Finally, the concentration of short–selling activity and low lending fees in a subset of 31
ETFs suggest that researchers should be careful when using the entire sample of ETFs to address
questions related to short-selling.
Dark Shorts
In terms of market impact in the here and now, and how all this may have impacted the recent short-covering rally, it’s worth looking more closely at the CTL structure itself as described in a paper by Egle Karmaziene of the University of Groningen and Valeri Sokolovski of HEC Montreal:
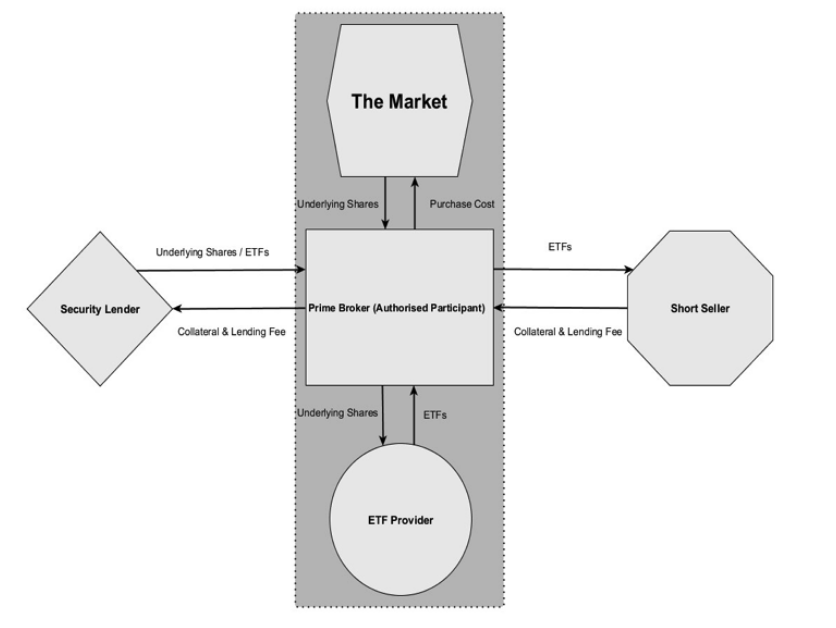
As the diagram shows, it is the privileged authorised participants (whose special relationship to ETF providers is not dissimilar to the relationship of primary dealers to bond issuers), who are most likely to be engaged in the “lend stocks you don’t own yet and collateralise, hedge, cover them later” activity.
Those for the large part are the Citadels, Jane Streets, Virtus, and bank Delta One departments of this world.
So what might be the impact if market conditions call on all of them to start closing operational shorts somewhat abruptly? And what if hedge funds can no longer absorb rising stock borrowing costs?
ETF shorts may represent only a small portion of overall short positioning in the market. But if those shorts are more naked in nature than appreciated (due to a fail-to-deliver penchant), it is entirely possible the impact of any covering episode could have a disproportional effect on valuations and stock lending fees.
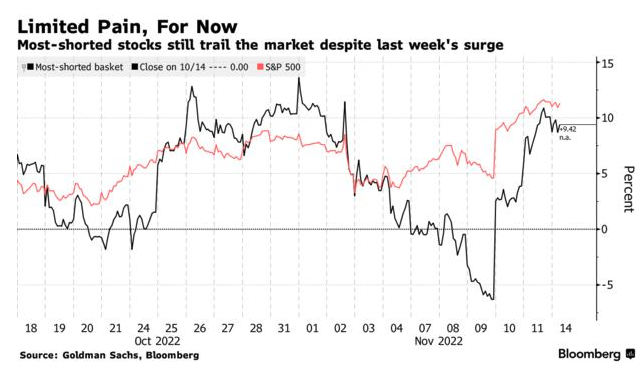
As an example of the potential whipsaw action to come, check out the following chart comparing the performance of the most shorted stocks relative to the S&P 500’s performance in recent weeks courtesy of Bloomberg:
As Bloomberg also reported:
At Goldman Sachs Group Inc., fund clients rushed to reduce shorts, particularly in macro products such as exchange-traded funds. Bearish positions in ETFs dropped 8.5% over the week through Thursday, marking the largest short covering since March 2021, according to the firm’s prime broker unit.
Is it safe to assume that the bulk of covering action is now done and dusted? If you trust conventional short-interest data (which is mostly too expensive for regular punters and degens to access) the answer is probably yes. Most of the short-interest fuel seems to have been expended by this point.
The degens, however, are unlikely to be convinced by that logic. As they like to argue, until official short-interest data reflects the full scope of market short positioning — i.e. it includes swaps, options, and dark operational market-maker shorts — “all reported short-interest data is so flawed that it’s worthless”. To their minds, there could be a lot more “dark short-interest” still out there.
If they’re right (and they might just well be) there could still be some mileage in the current short covering episode.
Now, if only stock-loan fees were publicly available for something other than… AMC!
Related Links:
“Get Shorty” – FINRA Requests Comment on Proposed Significant Changes to Short Position and Stock Loan Reporting – Sidley
A powerful rally has been driven largely by short covering, but valuations are now very rich – CNBC